Data-Driven: The Deployment Protocol
Greetings,
I hope you are doing well.
We have arrived at the finish line. Over the last three articles, we have journeyed from a blank page to a functioning data pipeline.
Ingest:
We built the discipline to capture reality (The Sheet).
Engineer:
We structured that reality into a clean format (The Schema).
Model:
We analyzed patterns and used simple AI to detect sentiment (The Dashboard).
Now, we face the final hurdle. A system that requires you to constantly tinker with it is not a system — it is a hobby. A true system must work for you. It must operate in the background and only alert you when necessary.
This brings us to the final layer: Deploy.
In this article, we will not be building new charts. Instead, we will build a “Virtual Consultant.” We will automate the process of reviewing your life by integrating a Large Language Model (LLM) to act as your weekly accountability partner
.Let’s complete the architecture.
The Theory: The Silent Engine
In the software world, “Deployment” (DevOps) is often the most underappreciated layer. It is the art of keeping the lights on. It is not about writing code; it is about reliability, automation, and monitoring.
For a Personal System, deployment consists of three pillars:
Serving:
How is the insight delivered? Does it require you to open a laptop and run a script (High Friction), or does it arrive as an email in your inbox (Low Friction)?
Automation:
The removal of human intervention. We want to move from “pulling” data (checking the sheet) to “pushing” insights (getting a notification).
Monitoring (The Drift):
Systems degrade. You might stop logging “Mood” or start lying about “Deep Work.” A deployed system detects these gaps and alerts you.
The Project: The AI Weekly Review
In the previous article, we used AI to detect sentiment (simple positive/negative scoring). Today, we are going to use AI for reasoning.
We are going to build a protocol where an LLM (like ChatGPT, Claude, or Gemini) reads your week’s data and writes a Qualitative Performance Review, exactly like a manager would.
Step 1: The “Context Window” Preparation
An LLM is only as smart as the data you feed it. We cannot just paste our spreadsheet; it’s too messy. We need to serialize our data into a narrative format.
If you are using the Streamlit App from Part 3, you can download your processed CSV. If you are using Google Sheets, simply copy your last 7 rows including the headers.
Step 2: The “Consultant” Prompt
I have engineered a prompt designed to strip away the “AI niceness” and force the model to act as an objective analyst.
The Workflow:
Every Sunday evening.
Open your preferred AI (ChatGPT Plus, Claude, etc.).
Paste the following prompt (The System Protocol).
Paste your last 7 rows of data below it.
Start of Prompt
Role: You are the Chief of Staff for a high-performance individual. Your goal is to analyze the user's weekly data log to optimize for two variables: 1. Consistency (Adherence to habits) 2. Well-being (Energy and Mood stability)Context: - The user tracks data daily. - "Deep_Work" is measured in hours. - "Sentiment" is the AI-detected emotion (-1 to 1) from their journal. - "Day_Score" is a composite metric of productivity.Task: Analyze the provided CSV data for the last 7 days and generate a "Weekly Briefing" consisting of three sections.
Section 1: The Reality Check (Quantitative) - Calculate the average Day_Score and Deep_Work. - Identify the "Best Day" and "Worst Day" based on metrics, not mood. - Highlight one specific correlation (e.g., "On days you read 0 mins, your Mood dropped by X").
Section 2: The Blindspot (Qualitative) - Read the "Journal" and "Blocker" columns. - Identify one recurring psychological barrier the user is ignoring. - Be direct. Do not be overly encouraging. If the user failed, state it clearly.
Section 3: The Directive (Actionable) - Based on the data, provide ONE single focus for next week. - This must be a specific constraint (e.g., "No reading before 8 PM" or "Must hit 4 hours deep work on Tuesday").Data: [PASTE YOUR COPIED SPREADSHEET ROWS HERE]
Step 3: Why This Works (The Feedback Loop)
When I ran this on my own data last month, the AI caught a pattern I missed. It pointed out:
“You claim your blocker is ‘lack of time’, but your data shows your lowest energy days are actually the ones where you sleep the most. You aren’t tired; you are lethargic from over-sleeping.”
This is the power of Deployment. It separates the Reviewer (The AI) from the Doer (You). It prevents you from bargaining with yourself.
Level 2: True Automation (For the Engineers)
For those capable of writing Python, we can remove the copy-paste step entirely. We can deploy a “Cron Job” (a scheduled task) that runs every Sunday at 8:00 PM.
The Architecture:
Script:
A Python script fetches your Google Sheet data (via API).
Process:
The script formats the last 7 days into a JSON string.
LLM Call:
The script sends this JSON to the OpenAI API with the system prompt above.
Delivery:
The script emails the response to you (using SMTP) or sends it to a Telegram bot.
Note: I will be adding a “Generate Report” button to the Streamlit app which does exactly this for you.
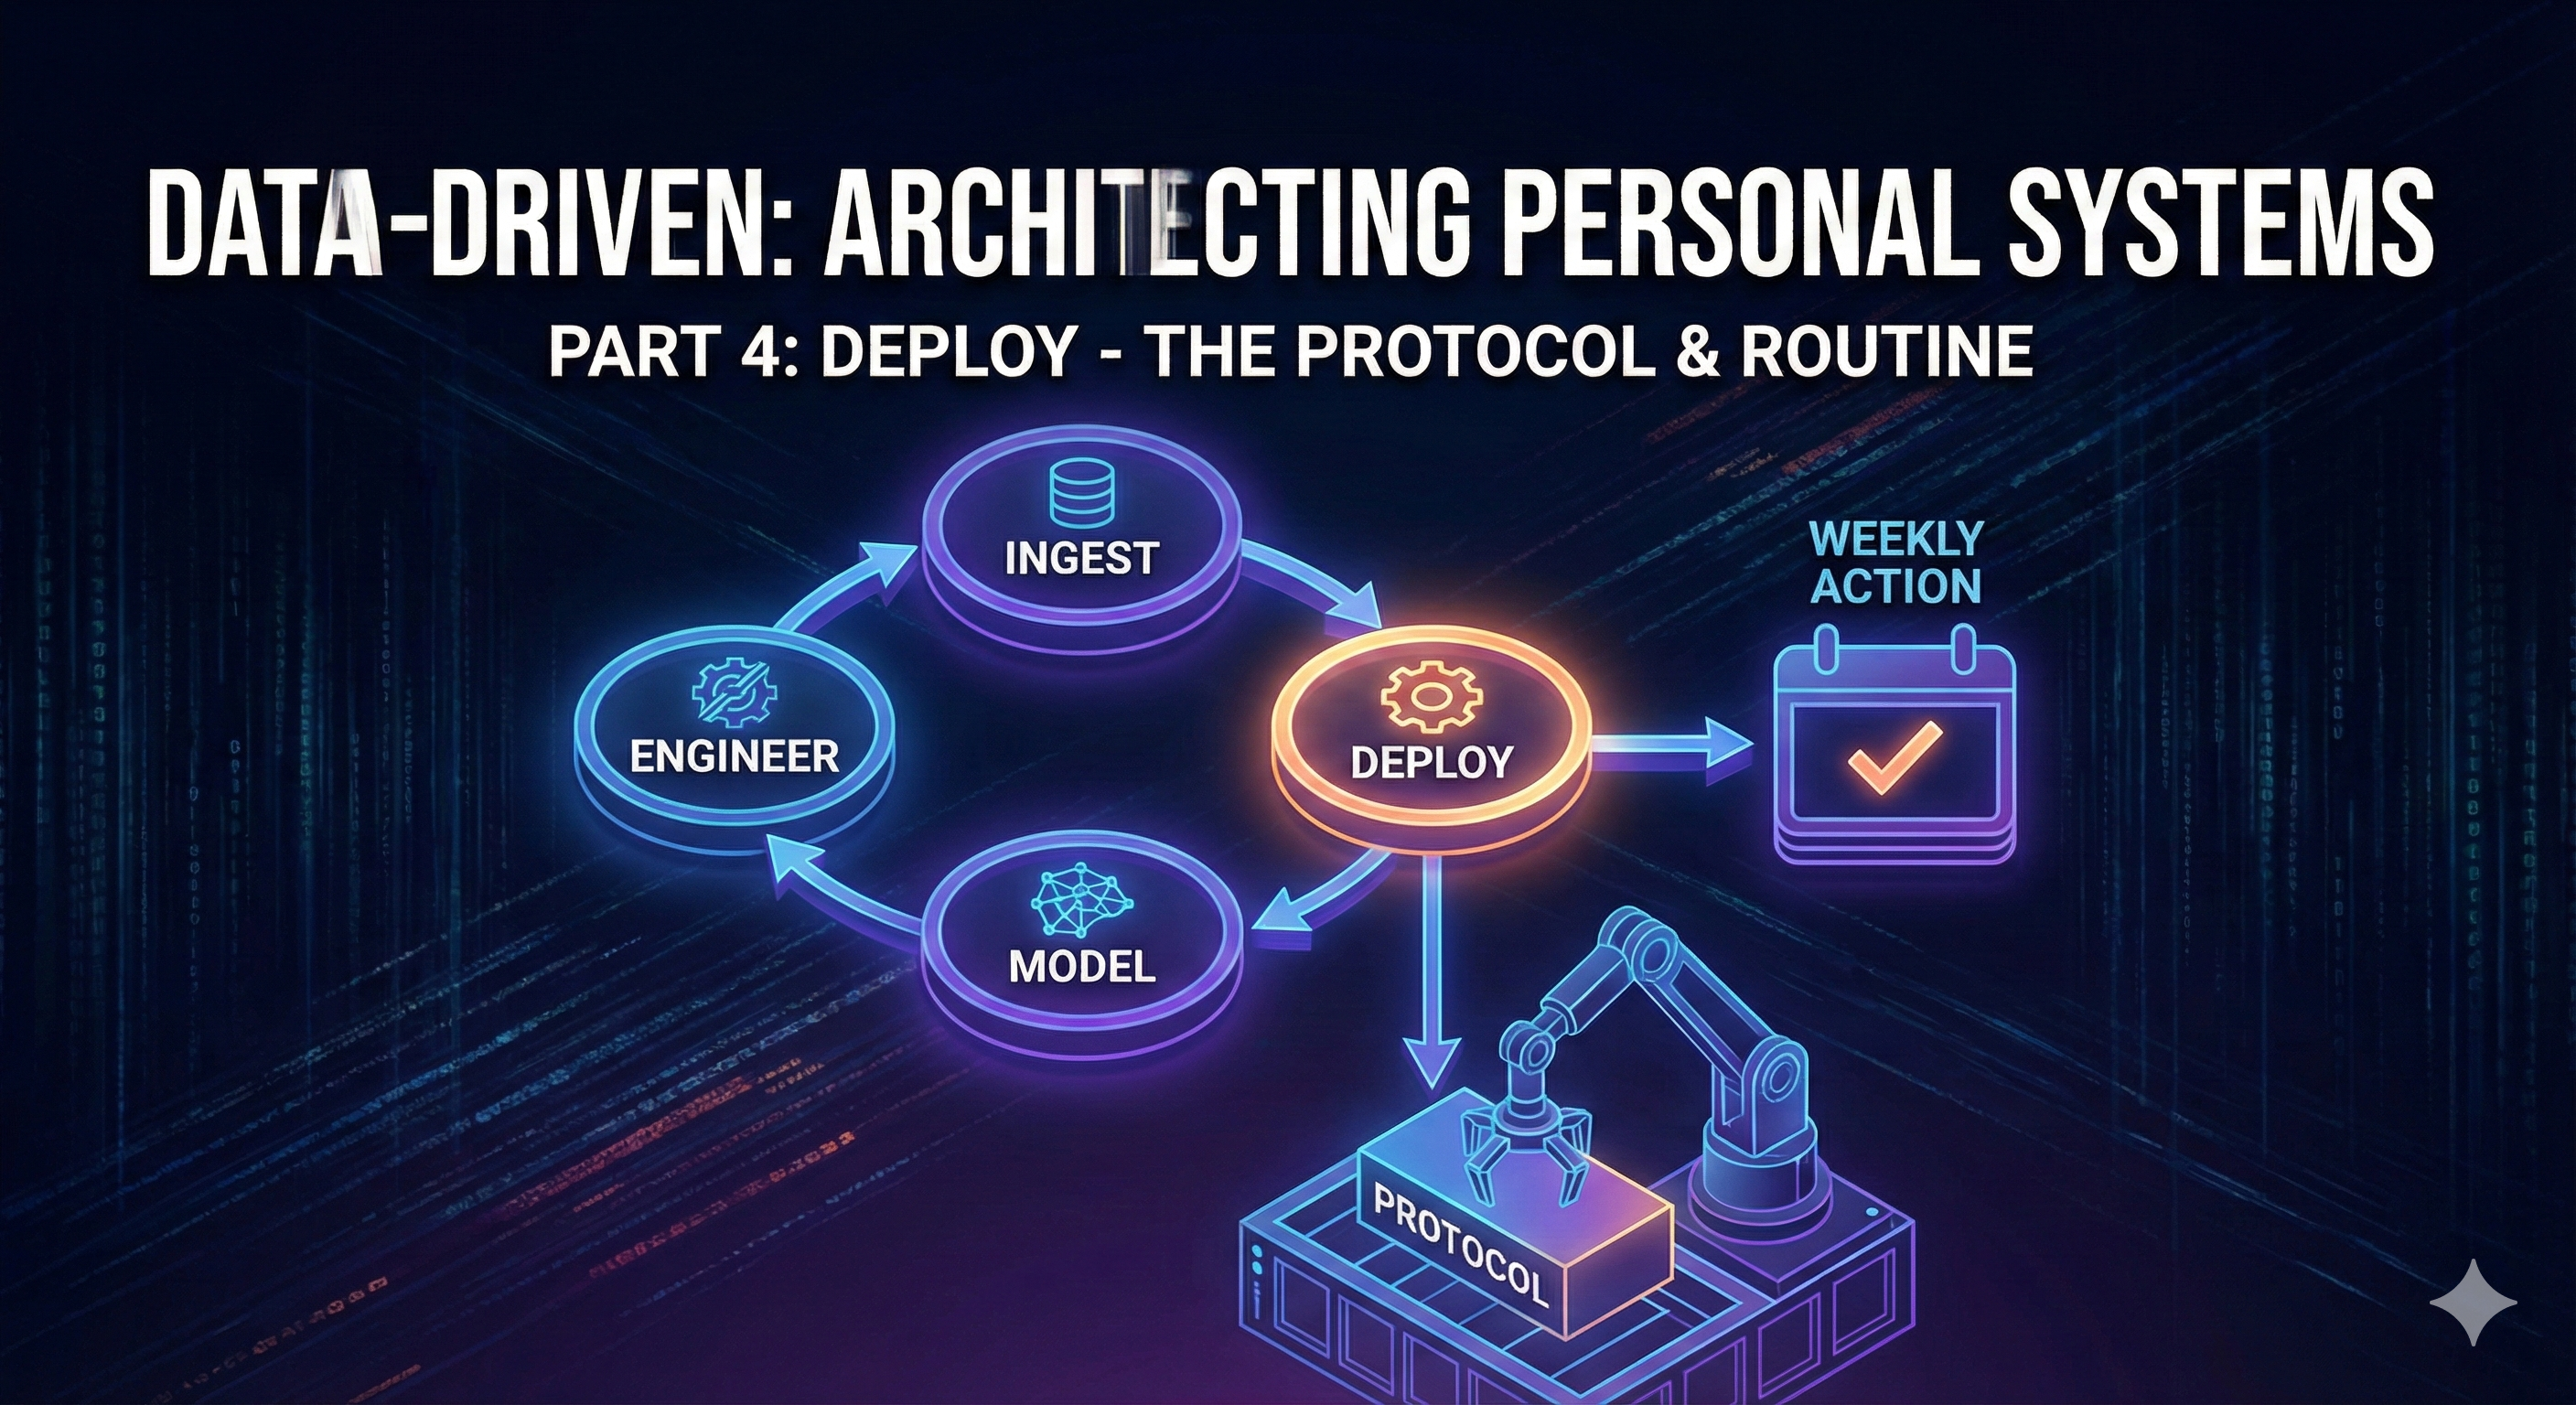
The Final Review: The 4-Layer System
We have now architected a complete Personal Data System.
Let’s look at the finished blueprint:
Ingest (The Sheet):
You spend 60 seconds each night logging the reality of your day. This builds your
Dataset
.
Engineer (The Pipeline):
Your data is cleaned and structured. Text is converted to sentiment scores; messy inputs are validated.
Model (The Analysis):
Visual dashboards reveal trends over weeks and months, showing you the trajectory of your life.
Deploy (The Feedback):
An automated intelligence reviews your logs weekly, spotting blind spots and keeping you accountable.
Conclusion
This series started with a simple premise: What gets measured, gets managed.
But we have gone a step further. We are not just managing; we are architecting. By treating your life’s data with the same rigor a company treats its financial data, you gain a superpower: Objectivity.
You no longer have to guess if you are burnt out — the data will tell you. You no longer have to wonder if a habit is working — the correlation matrix will show you.
I hope this series has given you the tools to stop drifting and start steering.
The repository, the prompts, and the templates will remain available and will be updated as I refine my own system.Thank you for building with me.
Until next time.