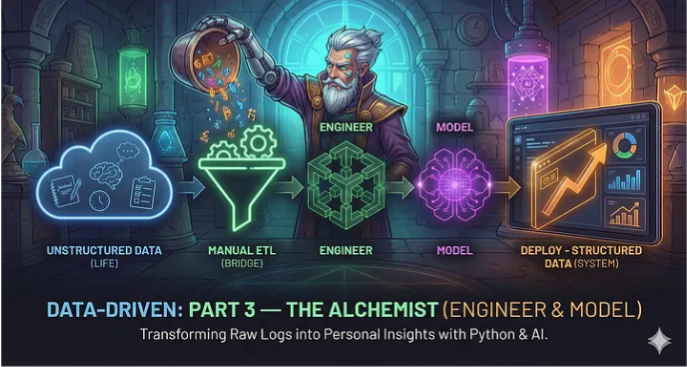
Data-Driven: Part 3 — The Alchemist (Engineer & Model)
Greetings,
I hope you are doing well and that your data collection has been consistent.
If you have been following the series, you currently have a Database (Google Sheet) and a Log (Obsidian/Capacities). You are diligently entering rows every night. But rows are not insights. A spreadsheet can tell you what you did, but it is terrible at telling you why you did it. It cannot read your journal, it cannot find hidden correlations, and it cannot scale.
To turn this raw ore into gold, we must enter the next two layers of the Data Science Lifecycle: Engineer and Model.
In this article, we are going to upgrade our system. First, we will perform a critical upgrade to our data structure. Then, we will leave the spreadsheet behind. We will enter The Lab and use a Personal Operating System I have built for you. We will utilize Machine Learning to read your journal entries and mathematical models to uncover the architecture of your life
Let’s begin..
The Theory: The Chef and The Critic
Before we build, we must define the rules. In Data Science, “Ingest” is just buying groceries. Now we have to cook.1. The Engineer Layer (The Chef) Raw data is often “dirty” or incomplete.
Raw:
“I read for 30 minutes on Dec 19th.”
Engineered:
“I read 10% more than my weekly average.” Engineering is the process of cleaning, transforming, and creating new features (metrics) that give context to the raw numbers.
2. The Model Layer (The Critic) Once the data is clean, we analyze it.
Correlation:
Does “Deep Work” actually cause “Fatigue”?
Sentiment Analysis:
This is our secret weapon today. We will use AI to read the text of your journal and assign it a “Happiness Score” (-1 to +1). This allows us to graph your emotions scientifically.
Level 1: The Sheet Upgrade (Low Code)
For those who want to keep it simple, we can perform basic Engineering directly in Google Sheets. I have updated the template from the previous article.
1. The Schema Upgrade (Crucial Step)
In our previous article, our Google Sheet captured only Metrics (Numbers). Our Journal (Text) stayed in our note-taking app. However, to run Sentiment Analysis, the AI needs words to read. It cannot analyze a blank cell. We need to perform a “Schema Migration.”
Action:
Open your Google Sheet.
Go to the first empty column (likely Column L) and add the header:
Journal.From now on, when you do your evening log, paste a one-sentence summary of your day into this column.
(Optional) Fill in the last few rows with some text so we have data to test today.
2. The “Slicer” Dashboard I have also added a “Dashboard” tab to the template. Instead of looking at a static wall of numbers, you now have a control panel.
Select Start Date:
Pick any day.
Select Range:
View the last 7, 10, or 30 days.
The Result:
The charts update instantly to show you exactly that period.
Note: If you have already started your own sheet, simply copy the “Dashboard” and “Engine” tabs from this template into your file.
Level 2: The Personal OS (High Code)
Spreadsheets have limits. They cannot process Natural Language (NLP), and they look terrible on mobile. To build a true “System,” we need software. We need an interface that can ingest our data, run Python scripts to find patterns, and deploy beautiful visuals.
I have built this application using Streamlit. It acts as the “Alchemist” for your data.
You have two ways to use it:
The Builder Path:
You can write the Python code and run it locally (I will share the code at the end).
The User Path:
You can use the version I have already deployed to the cloud.
The Deployed App
To make this effortless, I have hosted the application for you. You do not need to install Python or set up a server. You simply bring your data
.Link: Data Driven Life
How to Connect Your Data
The app is designed to be privacy-first. It does not store your data; it only reads it for the session. You can connect in two ways:
Option A: The Drag & Drop (Easiest)
In your Google Sheet, go to File > Download > Comma Separated Values (.csv).
Open the App.
Select “Upload CSV” and drop your file.
The dashboard will generate instantly.
Option B: The Live Link (The Pro Way) If you want the app to stay in sync with your sheet without downloading files every day, you need to create a “Publish” link.
Open your Google Sheet.
Go to File > Share > Publish to web.
Crucial Step:
In the first dropdown, select your specific sheet (e.g., “Collect”) instead of “Entire Document.”
In the second dropdown, change “Web page” to Comma-separated values (.csv).
Click Publish and copy the link.
Paste this link into the App.
The “Magic” Feature: Sentiment Analysis
Once your data is loaded, look at the “Mood vs. AI Sentiment” chart. This is the power of the Model layer.
Mood (Red Line):
This is what you clicked (Subjective).
Sentiment (Blue Line):
This is what the AI read in your journal (Objective).
In my own data, I found a fascinating divergence. My “Mood Log” was often a 3/5 (Neutral), but my “Sentiment Score” was trending up. The model revealed that I was actually happier than I gave myself credit for. My perception was lagging behind my reality.
Conclusion
We have now traveled through three layers.
Ingest:
We captured the reality (Sheet).
Engineer:
We cleaned the mess (Python).
Model:
We found the patterns (AI).
We have moved from a static spreadsheet to a dynamic application that understands the tone of our writing.
A Request for Feedback This project is alive. The goal is to build a standard for Personal Systems. If you test the app (data-driven-life.streamlit.app), I want to hear from you.
Did the Sentiment Analysis match your mood?
Did the “Consistency Score” surprise you?
What charts are missing?
Please let me know your thoughts.
In the final article, Part 4: Deploy, we will take the final step: Automation. We will look at how to integrate Large Language Models (LLMs) to generate weekly qualitative reviews automatically.
Until next time.